Table of Contents
Total Sky Imager (TSI)
Principle
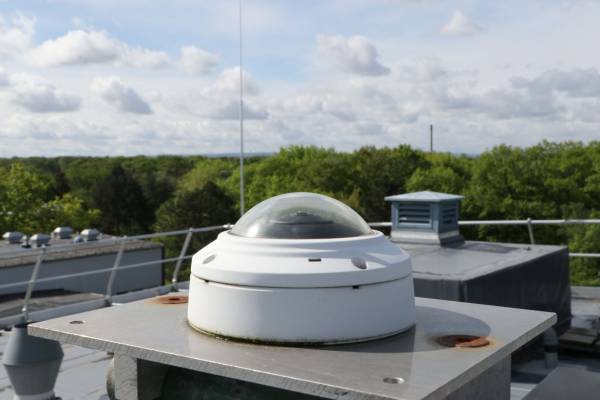
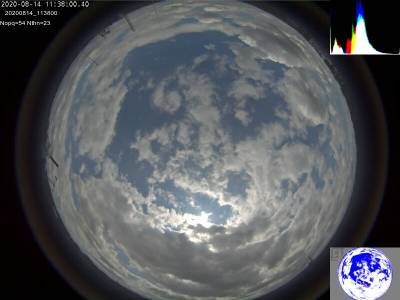
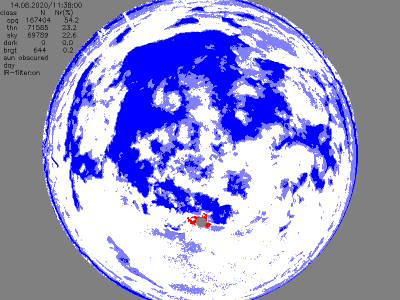
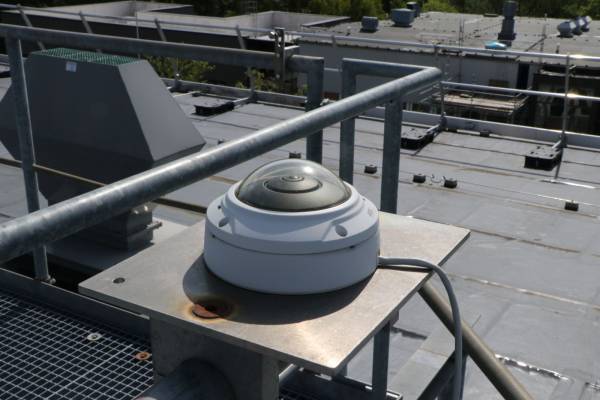
We use a commercially available fish-eye surveillance camera (AXIS M3027-PVE) to collect images of the sky and determine cloud amount. Images with a resolution of 800×600 pixels (BMP format) are taken every 20sec. Every unsaturated pixel above the horizon is investigated for its blue-to-red-ratio and categorized as sky (blue), thin-cloud (light-blue) or cloud (white or gray). Pixels are counted and stored as relative cloud amount as well as palette based png images. From the number of saturated pixels around the sun a flag for the visibility of the sun is derived.
Channels are in the visible range with average wavelengths of ~650nm (red), ~510nm (green), ~465nm (blue), have a broad spectral sensitivity and do overlap. Peak sensitivity wavelengths are at 560nm (red), 530nm (green) and 430nm (blue) (at least these are the peak sensitivities of our visual system which a camera tries to mimic). But unfortunately the system is not calibrated: the camera adapts its exposure to received light (i.e. sensitivity changes in time). White balance is set to a constant value to ensure that sensitivity of the channels relative to each other is constant. Every 15minutes is varied exposure (collecting time of the sensor) and gain (amplifier within the sensor) which might be used to derive an absolute calibration.
JOYCE-CF Standard Operation Procedures
- Every 20 second, one image is stored with a resolution of 800×600 pixel
Data availability
All data are available on request, please fill the data request sheet and send it to info@joyce.cloud
| Dataset | Temporal resolution | File size | Filename | Remarks |
|---|---|---|---|---|
| Hemispheric image | 20 seconds | 1 image per 20 seconds, 50-90 KB/image (4320 images per day) | YYYYMMDD_HHMMSS.jpg | |
| Hemispheric cloud mask | 20 seconds | 1 image per 20 seconds, 20-30 KB/image (4320 images per day) | YYYYMMDD_HHMMSS.jpg | |
| Cloud stripe | 20 seconds | 1 image per day (~3 MB) | stripe_YYYYMMDD.png |
Link to current observations
Data quicklooks can be found in the JOYCE quicklook archive.
Current sky image:
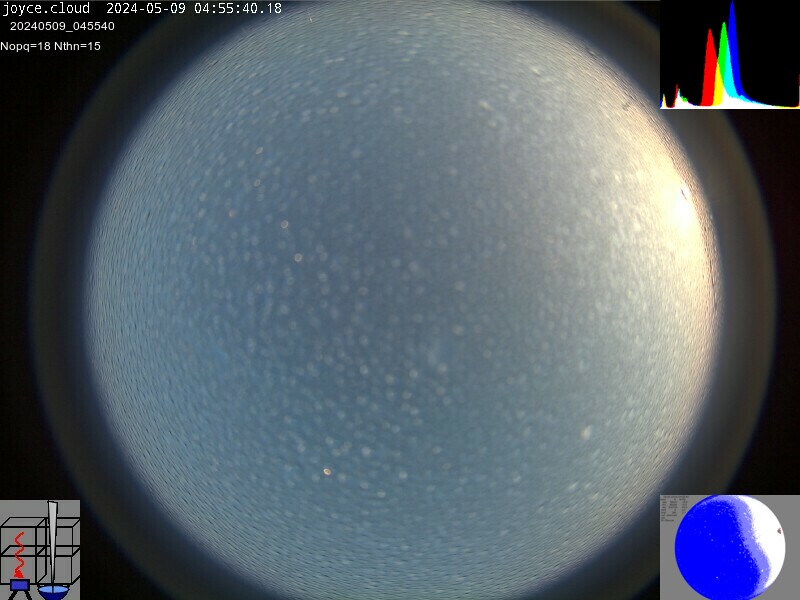
Link to further plots
Measurement examples
History
| Period | Place |
|---|---|
| 1.10.2015 - today | Research Center Jülich, Germany |
Technical Specifications
| Parameter | Specification | Remark |
|---|---|---|
| Wavelengths / nm | ~560, ~540, ~420 | freq. of peak sensitivities of human eye (⇒R,G,B) |
| Repetition Rate / s | 20 | Adjustable |
| resolution / deg | 0.15 | Resolutiuon in deg/pixel at zenith (see here) |
| Field-of-View / deg | 90 | cloud classification downto horizon |
| image size / pixel | 800×600 (=0.46MPx) | whole image (adjustable) |
| image size / pixel | 316 (=0.30MPx) | radius to horizon |
| Sensitivity / (mV Lux-1s-1)) | 1300 | According to Datasheet of sensor. We have no access to the voltage. |
| dyn.range / dB | 69 | |
| max S/N / dB | 37 | |
| Size / cm³ | ~20x20x15 | |
| Average Power consumption / W | < 4.5 | |
| Weight / kg | 0.5 (?) |
