This is an old revision of the document!
Table of Contents
Photovoltaic modules
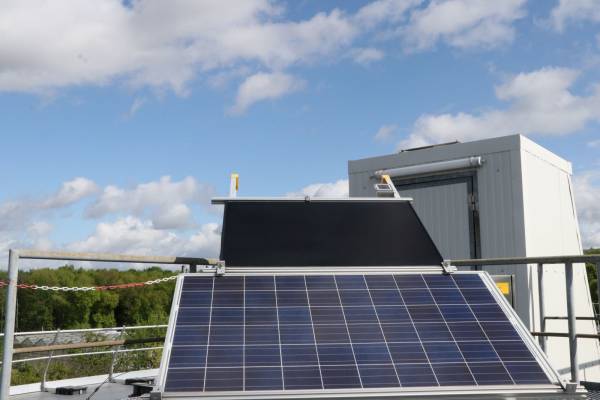
Two photovoltaic modules are installed at IEK-8 at Forschungszentrum Jülich to measure their radiation dependent energy yield by tracking the maximum power point in the recorded I-U-Curve.
Module I: SolarWorld SW 235-poly, polycrystalline
Module II: Solarmodul First solar FS-380, thin-film

Photovoltaic modules installed at JOYCE (front: Module I, back; Module II)
Principle - Photovoltaic
Photovoltaic modules convert radiation into electrical energy based on the so called photovoltaic effect (described by Einstein 1905). The photovoltaic effect is the stimulation of an electron to a higher energy state caused by absorption of light. Photovoltaic modules are based on semiconductors since their valence- and conduction band are completely separated, but the band gap is in the range of the energy of a photon. Thus, the photovoltaic effect causes electrons to migrate from the individual molecule structure to the conduction band. These electrons are so called free electrons. They are able to move randomly inside the crystal structure of the semiconductor. In order to produce electricity, which means to collect the excited electrons on the one side and “holes” on the other side, the semiconductors are p- and n-doped. In case of a silicon based module p-doping means to include atoms of the 3. main group and n-doping to include atoms of the 5. main group. In the region of contact, electrons of the n-doped layer move towards the p-doped layer and induce an electric field (depletion area). After a very short time this electric field reaches an equilibrium state since no more electrons can migrate to the p-doped layer. Now the free electrons are accelerated towards the positive depletion area due to this electric field. Thus, the negative charge is trapped in the conduction band in the n-doped layer and the positive charge is trapped in the p-doped layer. This induces an electric potential difference, which can be tapped from the solar module.
Principle - Yield measurements
The I-V curve (current voltage characteristic) of the modules is measured by a progressive increasing of the consumer resistance and simultaneous I-V measurements. The produced energy is released via a radiator.
Measurement modes
- Measurements with 1 minute temporal resolution (voltages, maximum current, irradiance, modue temperature)
Data availability
Data are available on request, please fill the data request sheet and send it to info@joyce.cloud
| Dataset | Temporal resolution | File size | Filename | Retrieval / Remarks |
|---|---|---|---|---|
| PVM data | 1 minute | 1 file per day (15-20 MB) | detailsYYYYMMDD.txt.gz | contains data from both modules |
Link to current observations
Current observations at quicklook archive
Measurement examples
Click here for more plots and explanations
The figure shows a velocity azimuth display (VAD): vectors give direction and speed of horizontal wind at time and height. Vectors pointing upward indicate south wind, vectors pointing to the right indicate west wind. Color shading gives the backscatter coefficient.
PVM History
| Period | Installation angle | Place | Project | Installed |
|---|---|---|---|---|
| 5. October 2016 - 02.01.2017 | 30°, southward | Forschungszentrum Jülich | ET-CC | yes |
| 03.01.2017 - 10.06.2020 | not installed (roof renovations) | |||
| 10.06.2020 - today | 30°, southward | Forschungszentrum Jülich | yes |
Technical specifications
| Parameter | SolarWorld SW 235-poly | First Solar - FS-380 |
|---|---|---|
| STC power | 235 Wp | 80 Wp |
| Current | 7.85 A | 1.65 A |
| Voltage | 30.2 V | 48.5 V |
| Short circuit current | 8.35 A | 1.88 A |
| Open circuit voltage | 37 V | 60.8 V |
| System voltage | 1000 V | 1000 V |
| Dimensions | 1675 mm x 1001 mm x 31 mm | 1200 mm x 600 mm x 7 mm |
| Weight | 21.2 kg | 12 kg |

